


January starts with a familiar scene in a Whitby service fleet. The dispatch board says vehicles are assigned, but one SUV is waiting for a brake part, another has an overdue inspection, and a third has barely moved since the seasonal rush ended. The shop may look busy, yet the manager still has to answer three practical questions: which vehicles are available, what did the fleet cost last week, and what is likely to fail next?
That's where fleet management KPIs earn their place. The right measures turn scattered work orders, fuel transactions, odometer readings, and driver reports into decisions. The wrong measures create a polished dashboard that tells you the fleet is active without showing whether it's productive, serviceable, or financially sound.
This guide is for mixed light-duty and service fleets in Ontario, including small commercial operators, municipal-style fleets, and teams beginning an EV pilot. Canadian weather, seasonal demand, inconsistent telematics coverage, and limited administrative capacity all affect what a useful KPI looks like in practice.
What a Fleet Manager Actually Decides With KPIs
A fleet manager rarely needs fifty numbers on Monday morning. The useful questions are narrower. Which vehicles can dispatch today? Which repairs are consuming shop capacity? Which assets are underused? Is preventive maintenance being completed before the vehicle becomes a roadside problem?
Consider a service fleet operating around Whitby, Oshawa, and Ajax. Winter can change demand, road conditions, battery performance, and repair priorities at the same time. A vehicle may be mechanically sound but unavailable because it's waiting for a scheduled service. Another may show strong utilization while accumulating avoidable wear. Looking at kilometres alone won't separate those situations.
A practical KPI scorecard should connect each number to a decision:
- Availability tells dispatch which assets can work.
- Utilization helps identify vehicles that may be underused or poorly allocated.
- Maintenance compliance shows whether scheduled work is being completed on time.
- Cost per kilometre connects daily operating choices to the budget.
- Fuel efficiency exposes changes in driving, route, loading, or vehicle condition.
- Safety and failure measures indicate whether operational pressure is creating risk.
KPIs are decisions, not dashboards. If nobody can act when a number changes, it belongs in a report, not on the front page.
The manager responsible for these choices also needs a reliable maintenance process. A practical overview of the responsibilities involved appears in this fleet maintenance manager guide, particularly around availability, scheduled service, repair turnaround, and avoidable field failures.
Canadian governance reinforces that point. Treasury Board guidance for federal light-duty fleets directs departments to monitor fuel consumption and vehicle operating, maintenance, and repair records, making documentation part of fleet control rather than a clerical afterthought (Treasury Board of Canada Secretariat guidance). For a smaller Ontario operator, the same principle applies. If the records are incomplete, the KPI may look precise while measuring paperwork instead of fleet performance.
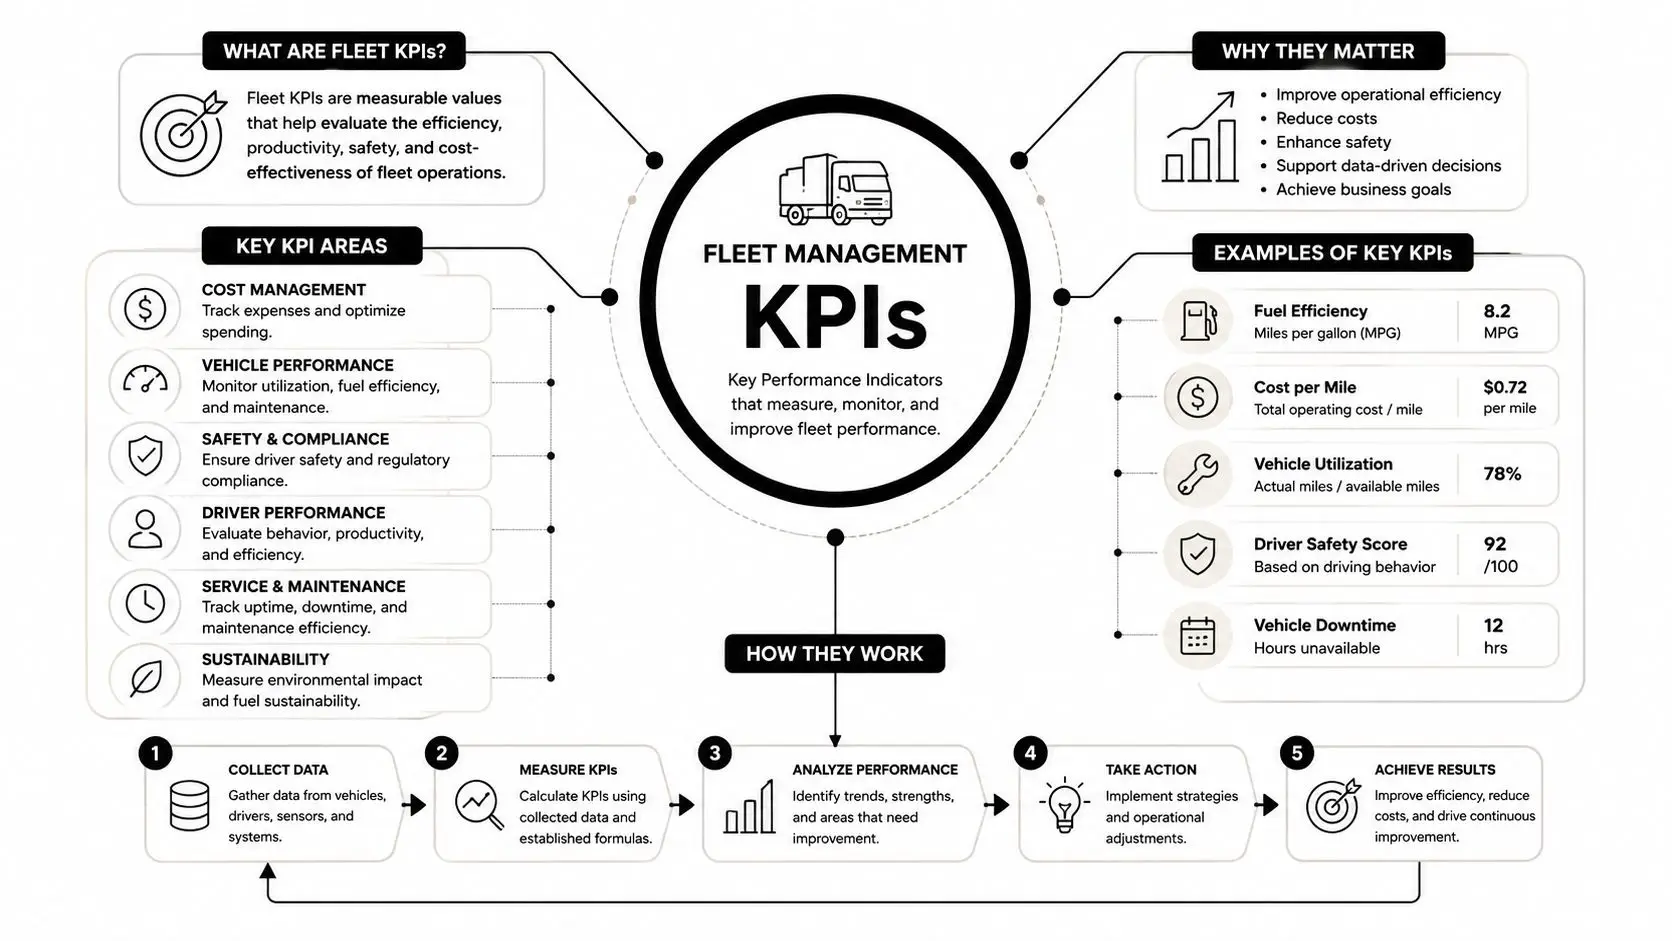
Defining Fleet Management KPIs and How They Work
A metric measures something. A key performance indicator measures something tied to an operational objective. Total kilometres driven is a metric. Cost per kilometre can become a KPI when the fleet's objective is to control lifecycle cost without reducing service capacity.
A vanity number looks impressive but doesn't change a decision. Total trips, total fuel purchases, or total vehicles owned may be useful inputs, but none explains whether the fleet is meeting its service obligations. A KPI needs an owner, a defined calculation, a reporting period, and an action threshold.
Leading and lagging indicators
Think of leading KPIs as warning lights and lagging KPIs as the bill that arrives afterward.
Leading indicators help a manager intervene early. Examples include:
- Preventive maintenance work approaching its due date
- Inspection completion
- Rising idle time
- Increasing diagnostic alerts
- Declining utilization on a specific asset class
Lagging indicators show the outcome after events have occurred. Examples include:
- Total maintenance cost
- Cost per kilometre
- Downtime
- Unscheduled repair frequency
- Warranty recovery
A maintenance backlog can be a leading warning. A breakdown and its repair invoice are lagging outcomes. Tracking only the invoice means the shop is always learning after the damage has occurred.
Apply a simple quality filter
Use the SMART test before accepting a KPI from a software vendor or consultant:
- Specific: Does it describe a defined vehicle group, activity, or period?
- Measurable: Can the source data be collected consistently?
- Achievable: Does the target reflect the fleet's operating conditions?
- Relevant: Does the number influence dispatch, maintenance, safety, or cost?
- Time-bound: Does it show when performance was measured?
A hydraulic service fleet may need a different efficiency view from a passenger SUV pool. For a more specialised example of performance benchmarking, the KPI guide for hydraulic efficiency offers useful context for connecting technical performance measures to operating decisions.
The mental model is straightforward. Ask what you want to improve, identify the behaviour that predicts it, then select the outcome measure that confirms it. If the number changes but nobody knows what to do next, it isn't ready to be a KPI.
The Core Operational KPIs Every Fleet Tracks
A one-page scorecard should begin with operational control, not software features. The formulas below are deliberately simple. A small Ontario fleet can calculate them with work orders, fuel records, odometer readings, and a basic spreadsheet, then improve the data later with telematics.
The measures that belong on the wall
Utilization rate measures how much an available vehicle is being used for productive work. A basic formula is productive operating time divided by available operating time. For mixed fleets, avoid one universal target. A service van needed for emergency response may need spare capacity, while a lightly used pool SUV may signal excess capacity. Natural Resources Canada recommends using telematics to examine daily, weekly, monthly, and annual utilization patterns, then applying customizable thresholds to find idle assets (Natural Resources Canada fleet data guidance).
Availability measures the proportion of scheduled time a vehicle is ready for use. The formula is available scheduled hours divided by total scheduled hours, multiplied by 100. Toronto's reported 2023 availability figures were 94% for light-duty vehicles, 88% for medium-duty assets, and 81% for heavy-duty assets (Toronto fleet availability reference). These figures are useful anchors, not automatic targets for every operation.
Serviceability asks a sharper question than ownership count: how much of the fleet is usable? A Canadian military research paper reported 49 per cent serviceability between 2023 and 2024 for key Canadian Army fleets and described that level as neither enabling nor sustainable (Canadian military research paper). The warning is clear. Availability should sit beside repair backlog, parts delays, and turnaround time.
Cost per kilometre is total fleet cost divided by kilometres travelled. Include fuel, maintenance, insurance, licensing, financing or lease costs, and other defined operating expenses. Keep fixed and variable costs separate so a seasonal decline in kilometres doesn't make variable operations look worse than they are.
Fuel cost per kilometre divides fuel spend by kilometres travelled. Litres per 100 kilometres divides litres consumed by kilometres travelled, then multiplies by 100. Fuel cards show transactions, but telematics can explain the driving pattern behind changes, including idle time, route conditions, and vehicle use.
Preventive maintenance compliance is completed scheduled maintenance divided by scheduled maintenance due, multiplied by 100. Define the due date before measuring performance. A work order marked complete after a breakdown shouldn't be counted as successful preventive maintenance.
Mean distance between failures divides total kilometres by the number of defined failures. Keep the failure definition stable. A warning light, a missed inspection, and a tow-worthy immobilisation shouldn't be mixed into one category.
Safety incidents per million kilometres divides reportable incidents by kilometres travelled, multiplied by one million. The denominator must stay consistent, and near misses should be tracked separately because they're useful leading signals.
Core operational KPIs at a glance
| KPI | Formula | Benchmark Range | Data Source |
|---|---|---|---|
| Utilization | Productive operating time ÷ available operating time | Set by asset class and seasonal demand | Telematics, dispatch records |
| Availability | Available scheduled hours ÷ total scheduled hours × 100 | Toronto 2023 reference, 94% light-duty, 88% medium-duty, 81% heavy-duty | Dispatch, work orders |
| Serviceability | Usable vehicles ÷ assigned fleet × 100 | Establish an internal baseline | Inspection and maintenance records |
| Cost per kilometre | Total fleet cost ÷ kilometres travelled | Compare against your own history | Accounting, fuel, odometer |
| Fuel efficiency | Litres ÷ kilometres × 100 | Compare by vehicle class and season | Fuel cards, odometers, telematics |
| PM compliance | Completed PMs ÷ scheduled PMs × 100 | Set by maintenance policy | Work orders, inspection system |
| Failure distance | Kilometres travelled ÷ defined failures | Compare by vehicle class | Telematics, repair records |
| Safety incident rate | Incidents ÷ kilometres × 1,000,000 | Establish a consistent internal baseline | Incident reports, telematics |
For implementation, a written fleet maintenance schedule should define what counts as due, completed, deferred, and failed. Without those definitions, two technicians can record the same event differently and produce conflicting results.
Financial and Lifecycle KPIs That Tie to the P&L
Operational numbers tell you what the fleet is doing. Financial KPIs tell you whether those activities support the business. A vehicle can post strong utilization and still destroy margin if it requires frequent repairs, consumes more fuel than its replacement, or spends too much time unavailable.
Build total cost around the vehicle's full life
Total cost of ownership per vehicle should include acquisition or lease cost, financing, insurance, licensing, fuel or electricity, maintenance, repairs, downtime, and disposal value. Divide the total by the ownership period for a time-based view, or by kilometres for an operating-cost view.
Cost per kilometre becomes more useful when split into:
- Fixed costs, which continue whether the vehicle moves or not
- Variable costs, which rise with kilometres, engine hours, fuel, wear, and service demand
- Downtime costs, which capture the operational consequence of an unavailable vehicle
Downtime is often omitted because it doesn't arrive as a single invoice. If a technician misses a scheduled job because the assigned vehicle is on a hoist, the cost may appear as overtime, a delayed customer, or lost capacity. Define the cost consistently rather than pretending it doesn't exist.
Depreciation should be reviewed by vehicle class and replacement timing. A high repair bill doesn't automatically justify replacement, and a low repair bill doesn't prove that an older asset remains economical. Compare maintenance cost trends, availability, fuel efficiency, expected residual value, and operational suitability.
A used-truck appraisal resource such as Leverage Auto Appraisals used truck valuation can help inform the disposal-value side of a lifecycle calculation. The appraisal itself isn't a fleet KPI, but the resulting residual-value estimate affects TCO and replacement decisions.
Treat EV pilots as an operating comparison
An EV pilot shouldn't be judged by an adoption percentage alone. Compare energy cost per kilometre, charging availability, charging-related downtime, maintenance completion, route suitability, and seasonal operating results against a comparable internal combustion vehicle.
A credible comparison needs the same operating boundary. If one vehicle's cost includes home charging installation and the other vehicle's calculation excludes fuel-card administration or downtime, the result is misleading. Canadian connected-fleet guidance links telematics with more accurate fuel and greenhouse-gas reporting, while also identifying a gap in practical Canada-region thresholds for mixed ICE and EV fleets (TELUS Business fleet efficiency report).
Parts availability also affects lifecycle cost. A missing filter, sensor, tyre, or EV-specific component can extend downtime even when the repair itself is straightforward. Use a defined parts inventory management process to connect stock decisions with repair turnaround and asset availability.
Where the Data Actually Comes From
The formula is the easy part. The difficult part is deciding which record is trusted when the odometer, fuel card, work order, and telematics feed disagree.
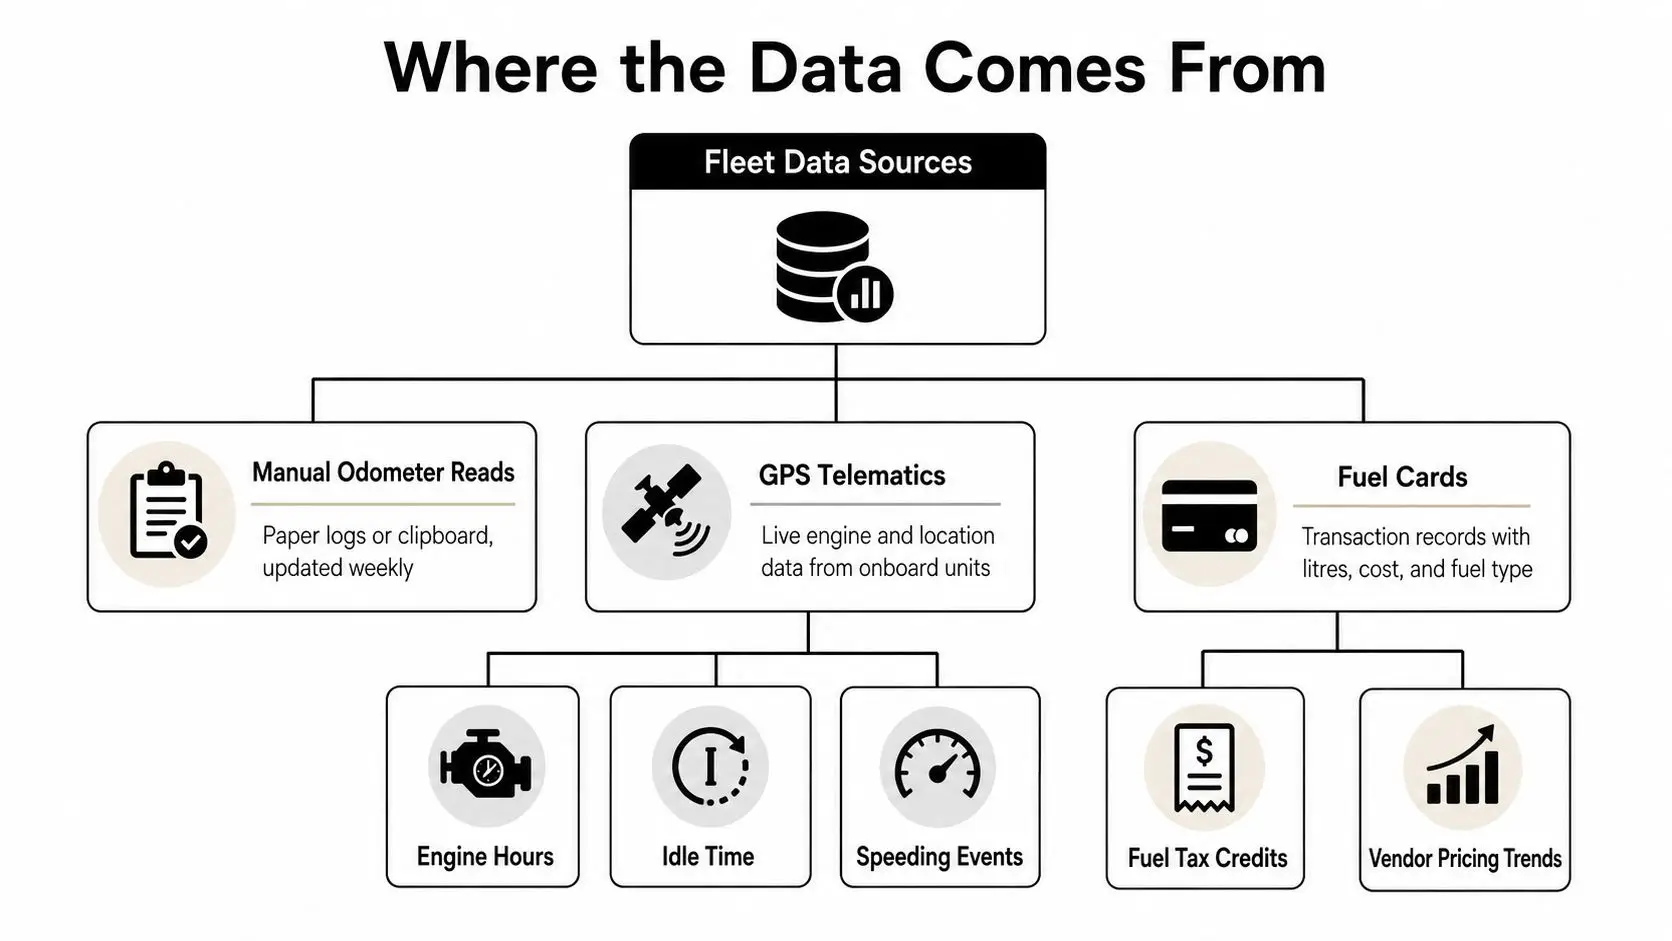
A manual odometer reading is inexpensive and accessible, but it depends on a driver or coordinator entering it consistently. Fuel-card data records who purchased fuel, where, when, how many litres, and at what cost. It doesn't explain the vehicle's driving between transactions. Telematics adds engine hours, location, movement, idle time, and selected driver events, but installation, privacy, connectivity, and subscription decisions still matter.
Match the source to the question
Use odometers for distance-based cost and fuel calculations. Use fuel cards to verify litres and pricing. Use telematics to examine utilization, idle time, engine hours, and route intensity. Use shop work orders for repair dates, parts, labour, and completion status. Use driver inspection apps or paper DVIs for pre-use defects and safety records.
You need at least two sources for a credible litres-per-100-kilometres KPI. Fuel transactions tell you what entered the tank. Odometer or telematics data tells you the distance that consumed it.
Natural Resources Canada's guidance supports telematics-derived utilization analysis across multiple time periods and recommends customizable thresholds for finding idle capacity (Natural Resources Canada utilization guidance). The Canadian Vehicle Survey infrastructure also supports province-level comparisons of vehicle kilometres, which makes operating intensity more useful than a simple mileage total.
Start with the system you can maintain
A small fleet doesn't need a complex platform before it has clean records. A shared spreadsheet can work if every vehicle has a stable identifier, every entry has a date, and one person reviews exceptions. A plug-and-play telematics unit can reduce manual entry, but it won't repair an inconsistent maintenance vocabulary.
Ontario's open data environment also highlights a practical limitation. Fleet telematics data isn't publicly available through the province's open data portal, so operators often need to build their own internal baseline rather than borrow a standard local benchmark (Ontario open data fleet telematics reference).
Use GPS fleet tracking to boost field productivity only when the operational question justifies it. Before buying anything, check whether the system can export raw odometer, trip, idle, and event data.
A simple quality checklist catches most failures:
- Vehicle identity: Match plate, VIN, asset number, and telematics ID.
- Time stamps: Record when a failure occurred, not only when a work order opened.
- Distance: Require an odometer reading at fuel, service, and disposal events.
- Status definitions: Separate available, assigned, in service, awaiting parts, and retired.
- Ownership: Assign one person to review missing or contradictory records each week.
Missing odometer logs damage fuel efficiency, cost per kilometre, and utilization calculations at the same time. Track the missing data as its own operational defect.
Choosing the Right Dashboard and Reporting Cadence
Tools don't create discipline. They make disciplined data easier to review, or bad data easier to display.
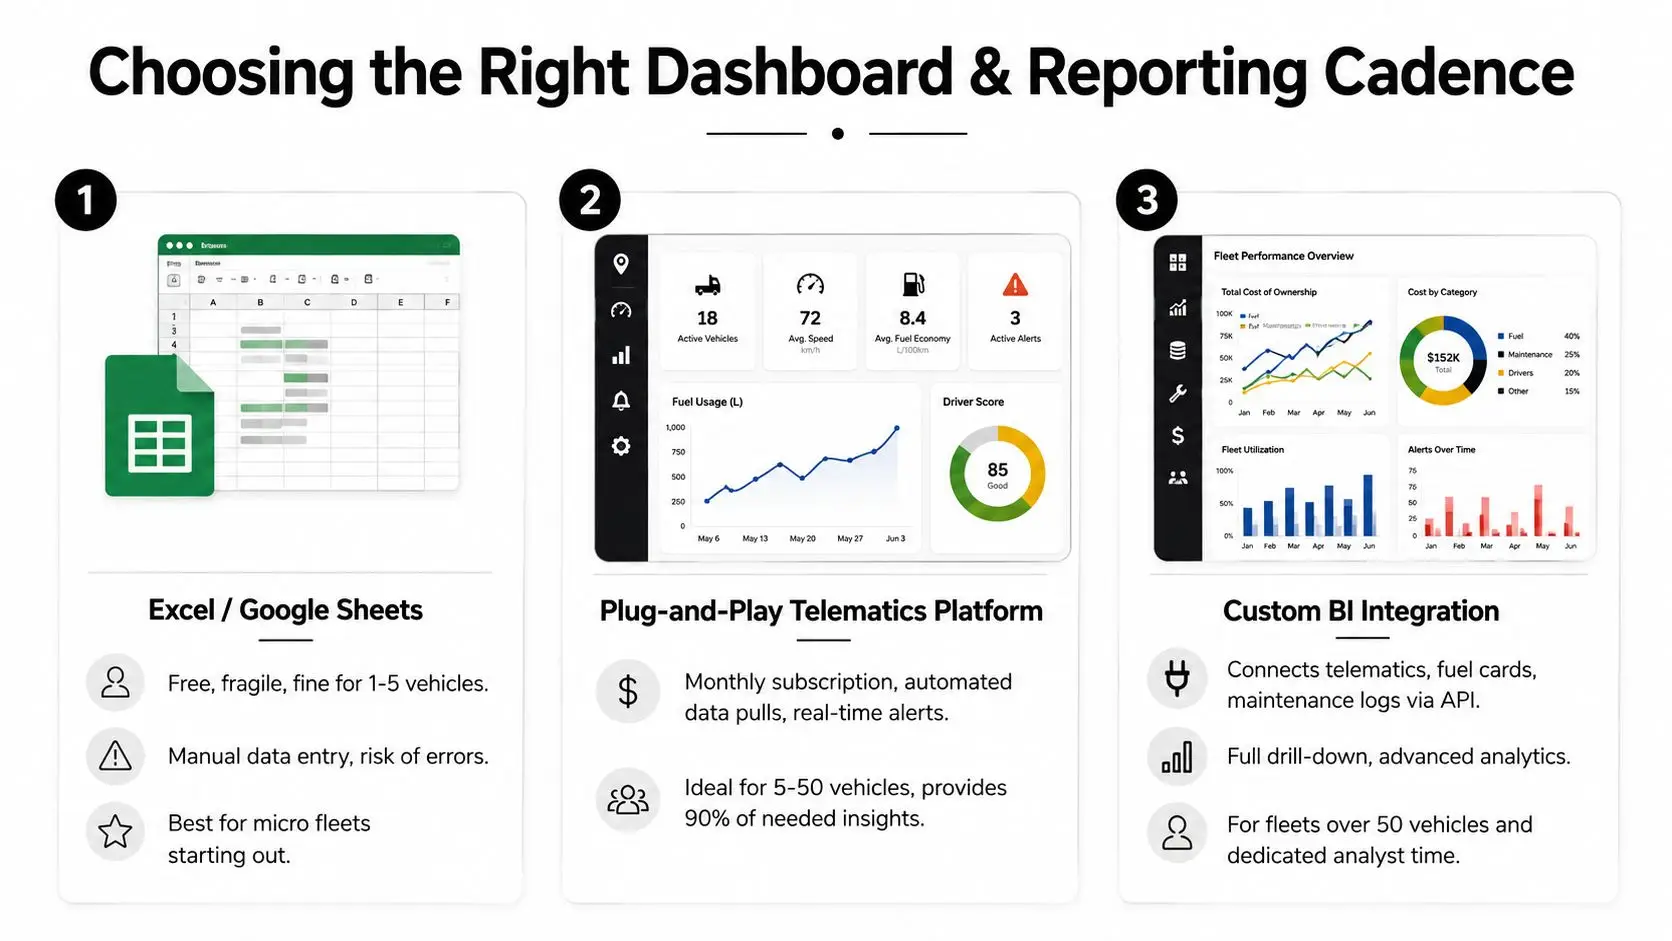
A micro fleet can start with Excel or Google Sheets. The owner or fleet coordinator can maintain a vehicle register, fuel log, repair log, and weekly exception sheet. This approach is fragile, but it's often enough to establish definitions and expose missing records before paying for a larger system.
A mid-tier telematics platform becomes useful when manual updates consume more time than the team can spare. Automated trips, engine hours, idle events, and location records support daily availability checks and weekly utilization reviews. The fleet still needs a maintenance owner because telematics won't know whether a vehicle is waiting for a part unless someone records that status.
An enterprise fleet system earns its cost when the operation needs integrated finance, maintenance, dispatch, fuel, compliance, and reporting workflows. It can provide deeper drill-down, but it also requires governance. More screens don't compensate for unclear definitions.
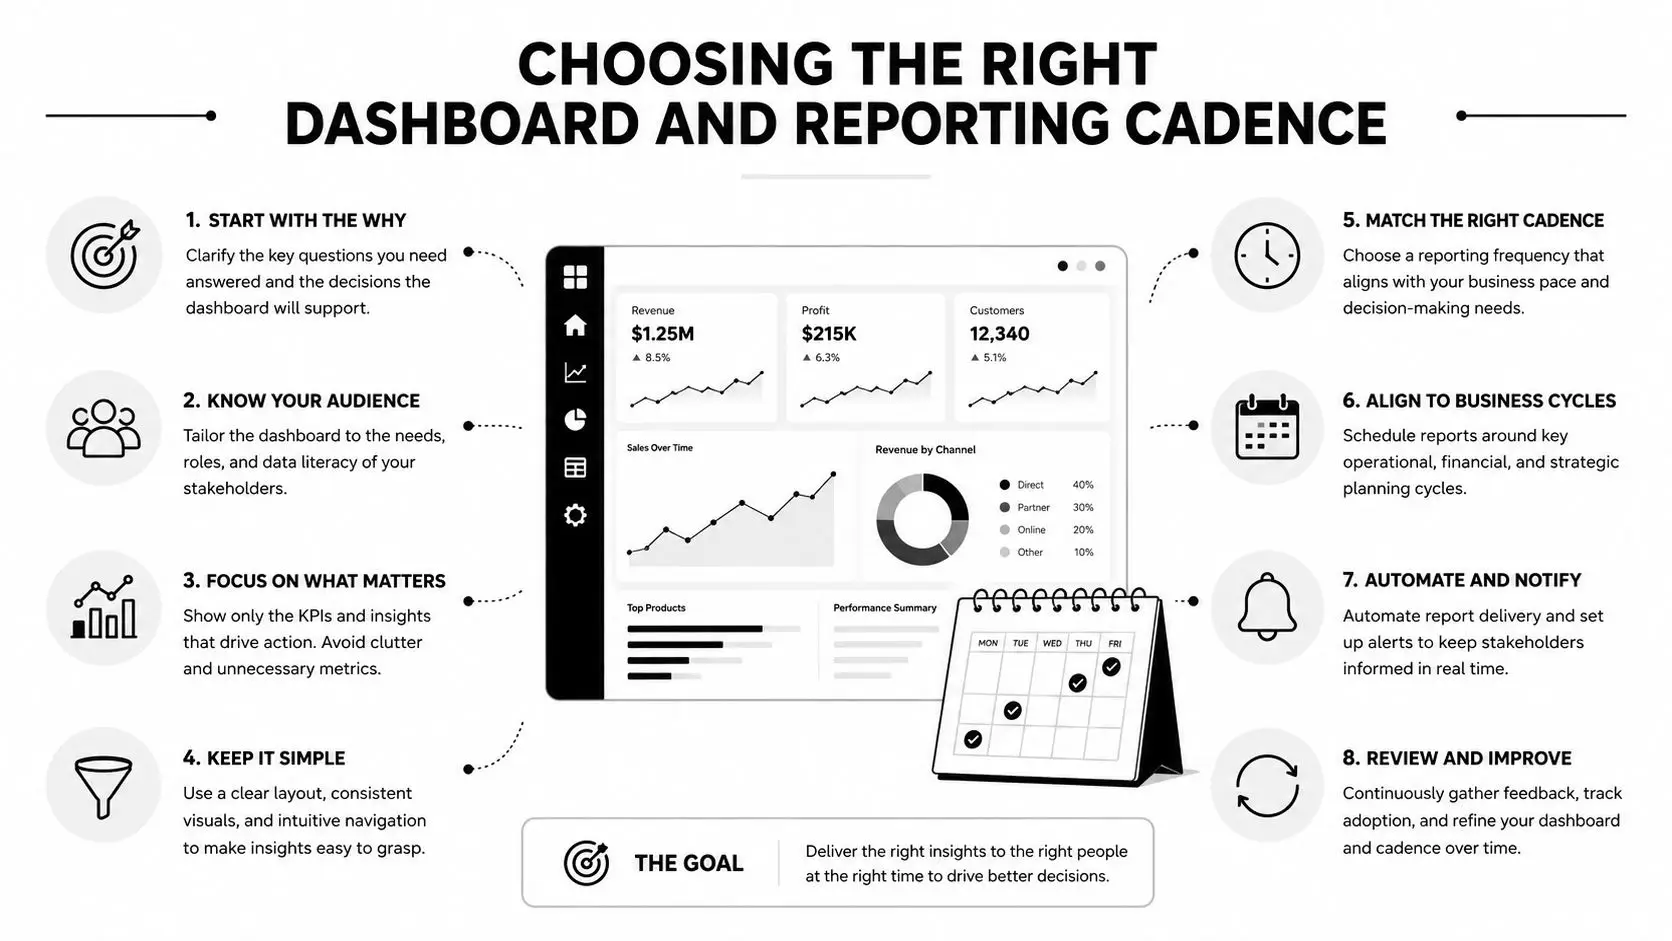
Use different cadences for different decisions:
- Daily: Availability, vehicles awaiting repair, safety exceptions, urgent defects
- Weekly: Utilization, PM due status, repair turnaround, fuel anomalies
- Monthly: Cost per kilometre, lifecycle cost, warranty recovery, replacement candidates
A Whitby shop owner reviewing the Friday dashboard might notice that PM compliance is slipping on service SUVs. The useful response isn't to admire the chart. It's to reserve bay capacity, confirm parts, and assign a person to contact the affected drivers.
Digital inspection records can make that handoff cleaner. A digital vehicle inspection system gives technicians and drivers a consistent place to document defects, approvals, and completion status, provided the team uses the workflow.
Common KPI Pitfalls and How to Fix Them
Most KPI programs fail through ordinary operational compromises, not complicated mathematics. The number is defined loosely, recorded inconsistently, and reviewed by someone who can't change the result.
The common traps
Vanity totals. Total kilometres can rise because demand rose, because drivers took inefficient routes, or because an underused vehicle was reassigned. Pair distance with productive utilization, cost, and service output.
Mixed vehicle classes. Comparing a compact service SUV with a heavy-duty truck hides the operating reality. Segment by class, role, drivetrain, geography, and seasonal use before setting expectations.
Seasonal distortion. A winter repair spike or summer demand surge can make a short reporting period look like a trend. Compare equivalent operating periods and mark seasonal context in the scorecard.
Availability without serviceability. A vehicle may be technically available for dispatch but unsuitable for a specific job because of payload, equipment, range, or inspection status. Define usable status around the work the vehicle must perform.
EV and ICE treated as identical. An EV pilot has charging windows, battery state, route constraints, and different maintenance tasks. Keep the same business objective, but adjust the operating measures so charging downtime and energy use remain visible.
No baseline. A vendor benchmark can help frame a conversation, but it shouldn't replace your own history. Establish internal performance before choosing an improvement target.
No owner. Every KPI needs one person responsible for data quality and one named response when the number crosses its threshold. Shared responsibility often means nobody acts.
Treasury Board guidance makes the documentation point explicit by requiring federal departments to monitor fuel consumption and vehicle operating and maintenance records (Canadian fleet governance guidance). That same logic belongs in a private or municipal-style fleet. Record quality enables the KPI; it isn't separate from performance management.
Next week, freeze a KPI dictionary, limit the main scorecard to the numbers managers can act on, and create an exception list for missing readings. A smaller, trusted scorecard beats a large dashboard built on inconsistent entries.
Putting It Together and Your First 90 Days
Start with a practical rollout. In the first week, reconcile vehicle IDs, odometer readings, fuel records, and open work orders. In the second, choose seven KPIs, write each formula, name the owner, and record the starting baseline. During the following weeks, review the scorecard weekly and fix the data-entry failures it exposes.
On Monday morning, check four numbers first:
- Utilization, to find capacity being left idle.
- Availability, to know what dispatch can use.
- Cost per kilometre, to connect operations with the budget.
- PM compliance, to catch preventable repair risk early.
After the baseline is stable, add EV-specific energy and charging measures, then use telematics to strengthen fuel and greenhouse-gas reporting. The objective isn't a larger dashboard. It's a fleet that gives dispatch, technicians, and owners the same operational picture.
Carmedics Autowerks Inc offers fleet maintenance, preventive service, commercial vehicle repairs, and digital inspection support for Whitby-area operators. Visit Carmedics Autowerks Inc to discuss how a practical maintenance process can improve availability, repair turnaround, and the quality of the fleet data behind your KPIs.